Overview
GetMCP includes built-in analytics that track every tool call made through your MCP servers. Use analytics to:
- Monitor which tools are being used most
- Identify errors and failing tool calls
- Track response times and performance
- See which AI clients are connecting
- Set up alerts for unusual usage

Dashboard Overview
The analytics overview shows at-a-glance metrics for today:
| Metric | Description |
|---|
| Total Tools | Number of tools across all servers |
| Success Rate | Percentage of successful tool calls |
| Avg Response Time | Average tool execution time in milliseconds |
| Unique Clients | Number of unique client IPs |
| Calls over Time | Chart of tool calls |
| Top Tools | Most called tools |
| Client Breakdown | Which AI clients are calling your tools |


Call Logs
The call log provides a detailed, paginated view of every tool call:
 Each log entry includes:
| Field | Description |
|---|
| Timestamp | When the call was made |
| Server | Which MCP server received the call |
| Tool | Which tool was called |
| Client Type | AI client that made the call (Claude, Cursor, etc.) |
| Client IP | IP address of the caller |
| Status | success or error |
| HTTP Status | Status code returned by the upstream API |
| Response Time | Time in milliseconds from request to response |
| Error Message | Error details if the call failed |

Filtering Logs
Filter call logs by:
- Date range — Select from/to dates
- Server — Filter by a specific server
- Status — Show only
success or error calls
- Search — Search by server name, tool name, client type, or IP
Exporting Logs
Export filtered logs directly from the Logs page. Apply any filters first, then click the Export dropdown in the top-right toolbar and choose a format. The export includes all matching rows, not just the current page.
CSV
Best for spreadsheets (Excel, Google Sheets) and business reporting.
ID,Timestamp,Server,Tool,Method,Status,HTTP Status,Response Time (ms),Client Type,Client IP,User Agent,Error Message
1,2026-05-19T06:36:15Z,my-server,get_weather,tools/call,success,200,854,cursor,127.0.0.1,Cursor/3.2.16,,
| Column | Description |
|---|
| ID | Row ID |
| Timestamp | UTC ISO 8601 timestamp |
| Server | Server name |
| Tool | Tool name |
| Method | MCP method (tools/call) |
| Status | success or error |
| HTTP Status | Upstream HTTP status code |
| Response Time (ms) | Round-trip time |
| Client Type | Detected AI client slug |
| Client IP | Caller IP address |
| User Agent | Caller user-agent string |
| Error Message | Error detail (errors only) |
JSON
Best for programmatic processing, dashboards, and data pipelines. Returns a JSON array of objects.
[
  {
    "id": 1,
    "created_at": "2026-05-19T06:36:15Z",
    "server_name": "my-server",
    "tool_name": "get_weather",
    "method": "tools/call",
    "response_status": "success",
    "status_code": 200,
    "response_time_ms": 854,
    "client_type": "cursor",
    "client_ip": "127.0.0.1",
    "user_agent": "Cursor/3.2.16",
    "arguments": {"city": "Dubai"},
    "error_message": null
  }
]
NDJSON
Best for streaming ingestion and log aggregators (Loki, Datadog, Elastic). Each line is a self-contained JSON object.
{"id":1,"created_at":"2026-05-19T06:36:15Z","server_name":"my-server","tool_name":"get_weather","response_status":"success","status_code":200,"response_time_ms":854}
{"id":2,"created_at":"2026-05-19T06:37:27Z","server_name":"my-server","tool_name":"get_weather","response_status":"success","status_code":200,"response_time_ms":745}
Large Exports
| Row count | Behaviour |
|---|
| 0 | Warning toast; no file downloaded |
| 1 – 5,000 | Instant download |
| 5,001 – 50,000 | Download with a browser-slowness warning |
| 50,000+ | Same warning; consider narrowing your filter or using the API |
per_page and pagination to stream data in chunks:
GET /wp-json/getmcp/v1/analytics/calls?date_from=2026-05-01&date_to=2026-05-31&per_page=500&page=1
Authorization: Bearer YOUR_API_KEY
Client Breakdown
See which AI clients are using your MCP servers:

| Client | Detected By |
|---|
| Claude Desktop | User-Agent header |
| Claude Code | User-Agent header |
| Cursor | User-Agent header |
| Windsurf | User-Agent header |
| ChatGPT | User-Agent header |
| Unknown | Unrecognized clients |
Log Retention
By default, call logs are retained for 30 days. Configure retention in GetMCP → Settings → General.
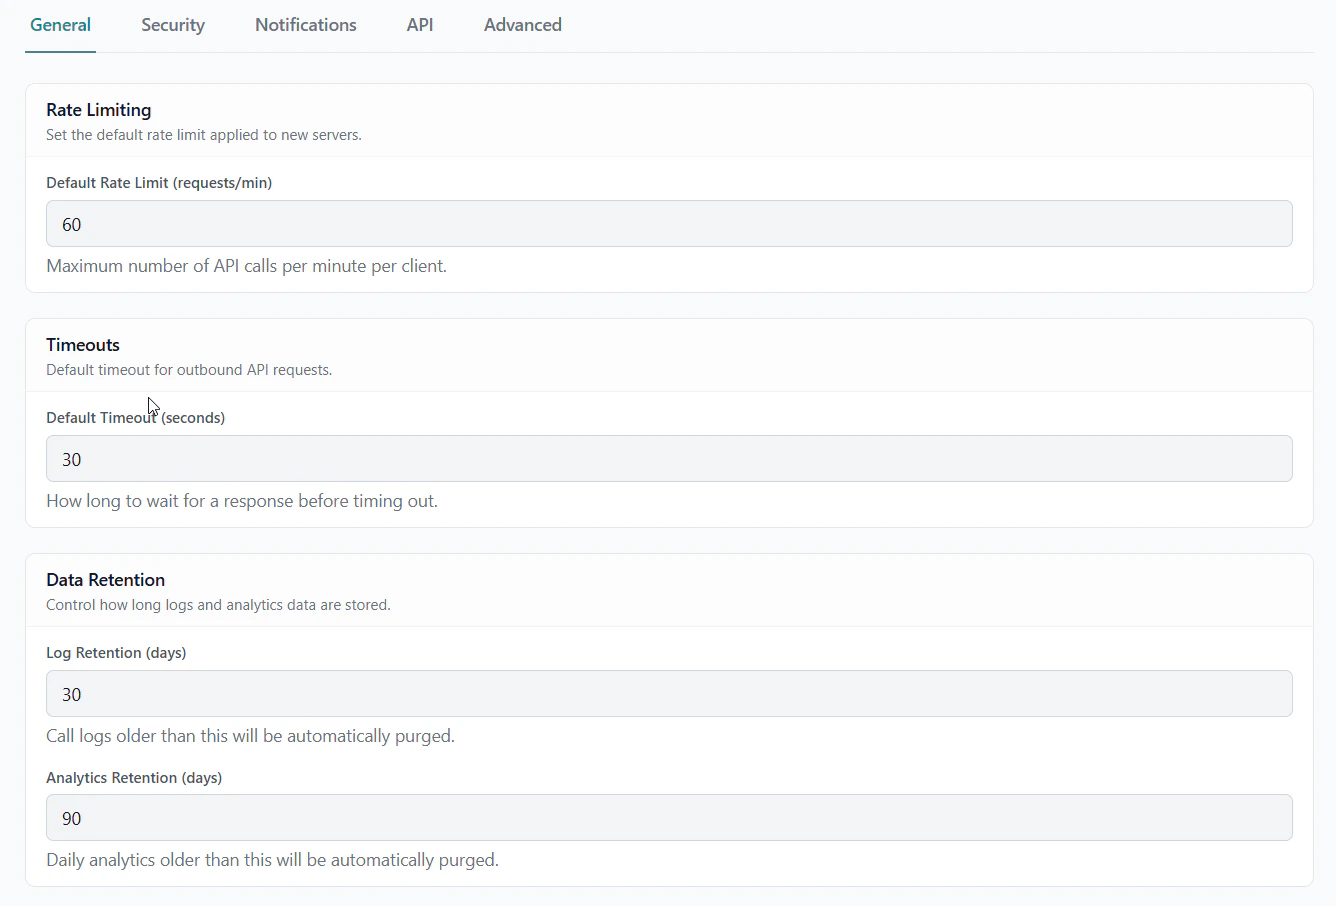
| Setting | Default | Description |
|---|
| Log Retention Days | 30 | How long to keep raw call logs |
| Analytics Retention Days | 90 | How long to keep aggregated daily stats |
| Default Rate Limit | 60 req/min | Applied to all new servers |
| Default Timeout | 30 seconds | How long to wait for upstream API response |
Email Alerts
Configure email notifications for errors, high usage, and health check failures at GetMCP → Settings → Notifications.

| Setting | Description |
|---|
| Enable email alerts | Toggle on to receive alert emails |
| Notification Email | Address where alerts are sent |
| Usage Alert Threshold | Daily call count that triggers a usage alert (default: 80) |
Emails use WordPress’s wp_mail(). If alerts aren’t arriving, install an SMTP plugin such as WP Mail SMTP.
Health Checks
Health checks periodically ping your configured tool endpoints to verify they are reachable. Enable them at GetMCP → Settings → Advanced.

| Setting | Description |
|---|
| Enable health checks | Automatically test tool endpoints at regular intervals |
| Check Interval | How often checks run (every hour, every 6 hours, daily) |
| Run Health Check | Manually trigger a check immediately |
Analytics API
Access analytics data programmatically via the REST API: