> ## Documentation Index
> Fetch the complete documentation index at: https://docs.getmcp.com/llms.txt
> Use this file to discover all available pages before exploring further.
# Analytics & Monitoring
> Monitor tool usage, performance metrics, and call logs in real time.
## Overview
GetMCP includes built-in analytics that track every tool call made through your MCP servers. Use analytics to:
* Monitor which tools are being used most
* Identify errors and failing tool calls
* Track response times and performance
* See which AI clients are connecting
* Set up alerts for unusual usage
 ## Dashboard Overview
The analytics overview shows at-a-glance metrics for today:
| Metric | Description |
| --------------------- | ------------------------------------------- |
| **Total Tools** | Number of tools across all servers |
| **Success Rate** | Percentage of successful tool calls |
| **Avg Response Time** | Average tool execution time in milliseconds |
| **Unique Clients** | Number of unique client IPs |
| **Calls over Time** | Chart of tool calls |
| **Top Tools** | Most called tools |
| **Client Breakdown** | Which AI clients are calling your tools |
## Dashboard Overview
The analytics overview shows at-a-glance metrics for today:
| Metric | Description |
| --------------------- | ------------------------------------------- |
| **Total Tools** | Number of tools across all servers |
| **Success Rate** | Percentage of successful tool calls |
| **Avg Response Time** | Average tool execution time in milliseconds |
| **Unique Clients** | Number of unique client IPs |
| **Calls over Time** | Chart of tool calls |
| **Top Tools** | Most called tools |
| **Client Breakdown** | Which AI clients are calling your tools |

 ## Call Logs
The call log provides a detailed, paginated view of every tool call:
## Call Logs
The call log provides a detailed, paginated view of every tool call:
 Each log entry includes:
| Field | Description |
| ----------------- | --------------------------------------------------- |
| **Timestamp** | When the call was made |
| **Server** | Which MCP server received the call |
| **Tool** | Which tool was called |
| **Client Type** | AI client that made the call (Claude, Cursor, etc.) |
| **Client IP** | IP address of the caller |
| **Status** | `success` or `error` |
| **HTTP Status** | Status code returned by the upstream API |
| **Response Time** | Time in milliseconds from request to response |
| **Error Message** | Error details if the call failed |
Each log entry includes:
| Field | Description |
| ----------------- | --------------------------------------------------- |
| **Timestamp** | When the call was made |
| **Server** | Which MCP server received the call |
| **Tool** | Which tool was called |
| **Client Type** | AI client that made the call (Claude, Cursor, etc.) |
| **Client IP** | IP address of the caller |
| **Status** | `success` or `error` |
| **HTTP Status** | Status code returned by the upstream API |
| **Response Time** | Time in milliseconds from request to response |
| **Error Message** | Error details if the call failed |
 ### Filtering Logs
Filter call logs by:
* **Date range** — Select from/to dates
* **Server** — Filter by a specific server
* **Status** — Show only `success` or `error` calls
* **Search** — Search by server name, tool name, client type, or IP
### Exporting Logs
Export filtered logs directly from the Logs page. Apply any filters first, then click the **Export** dropdown in the top-right toolbar and choose a format. The export includes **all matching rows**, not just the current page.
#### CSV
Best for spreadsheets (Excel, Google Sheets) and business reporting.
```csv theme={null}
ID,Timestamp,Server,Tool,Method,Status,HTTP Status,Response Time (ms),Client Type,Client IP,User Agent,Error Message
1,2026-05-19T06:36:15Z,my-server,get_weather,tools/call,success,200,854,cursor,127.0.0.1,Cursor/3.2.16,,
```
| Column | Description |
| ------------------ | -------------------------- |
| ID | Row ID |
| Timestamp | UTC ISO 8601 timestamp |
| Server | Server name |
| Tool | Tool name |
| Method | MCP method (`tools/call`) |
| Status | `success` or `error` |
| HTTP Status | Upstream HTTP status code |
| Response Time (ms) | Round-trip time |
| Client Type | Detected AI client slug |
| Client IP | Caller IP address |
| User Agent | Caller user-agent string |
| Error Message | Error detail (errors only) |
#### JSON
Best for programmatic processing, dashboards, and data pipelines. Returns a JSON array of objects.
```json theme={null}
[
{
"id": 1,
"created_at": "2026-05-19T06:36:15Z",
"server_name": "my-server",
"tool_name": "get_weather",
"method": "tools/call",
"response_status": "success",
"status_code": 200,
"response_time_ms": 854,
"client_type": "cursor",
"client_ip": "127.0.0.1",
"user_agent": "Cursor/3.2.16",
"arguments": {"city": "Dubai"},
"error_message": null
}
]
```
#### NDJSON
Best for streaming ingestion and log aggregators (Loki, Datadog, Elastic). Each line is a self-contained JSON object.
```ndjson theme={null}
{"id":1,"created_at":"2026-05-19T06:36:15Z","server_name":"my-server","tool_name":"get_weather","response_status":"success","status_code":200,"response_time_ms":854}
{"id":2,"created_at":"2026-05-19T06:37:27Z","server_name":"my-server","tool_name":"get_weather","response_status":"success","status_code":200,"response_time_ms":745}
```
#### Large Exports
| Row count | Behaviour |
| -------------- | ------------------------------------------------------------- |
| 0 | Warning toast; no file downloaded |
| 1 – 5,000 | Instant download |
| 5,001 – 50,000 | Download with a browser-slowness warning |
| 50,000+ | Same warning; consider narrowing your filter or using the API |
For recurring large exports, use the [Logs API endpoint](/api-reference/analytics/calls) with `per_page` and pagination to stream data in chunks:
```http theme={null}
GET /wp-json/getmcp/v1/analytics/calls?date_from=2026-05-01&date_to=2026-05-31&per_page=500&page=1
Authorization: Bearer YOUR_API_KEY
```
## Client Breakdown
See which AI clients are using your MCP servers:
### Filtering Logs
Filter call logs by:
* **Date range** — Select from/to dates
* **Server** — Filter by a specific server
* **Status** — Show only `success` or `error` calls
* **Search** — Search by server name, tool name, client type, or IP
### Exporting Logs
Export filtered logs directly from the Logs page. Apply any filters first, then click the **Export** dropdown in the top-right toolbar and choose a format. The export includes **all matching rows**, not just the current page.
#### CSV
Best for spreadsheets (Excel, Google Sheets) and business reporting.
```csv theme={null}
ID,Timestamp,Server,Tool,Method,Status,HTTP Status,Response Time (ms),Client Type,Client IP,User Agent,Error Message
1,2026-05-19T06:36:15Z,my-server,get_weather,tools/call,success,200,854,cursor,127.0.0.1,Cursor/3.2.16,,
```
| Column | Description |
| ------------------ | -------------------------- |
| ID | Row ID |
| Timestamp | UTC ISO 8601 timestamp |
| Server | Server name |
| Tool | Tool name |
| Method | MCP method (`tools/call`) |
| Status | `success` or `error` |
| HTTP Status | Upstream HTTP status code |
| Response Time (ms) | Round-trip time |
| Client Type | Detected AI client slug |
| Client IP | Caller IP address |
| User Agent | Caller user-agent string |
| Error Message | Error detail (errors only) |
#### JSON
Best for programmatic processing, dashboards, and data pipelines. Returns a JSON array of objects.
```json theme={null}
[
{
"id": 1,
"created_at": "2026-05-19T06:36:15Z",
"server_name": "my-server",
"tool_name": "get_weather",
"method": "tools/call",
"response_status": "success",
"status_code": 200,
"response_time_ms": 854,
"client_type": "cursor",
"client_ip": "127.0.0.1",
"user_agent": "Cursor/3.2.16",
"arguments": {"city": "Dubai"},
"error_message": null
}
]
```
#### NDJSON
Best for streaming ingestion and log aggregators (Loki, Datadog, Elastic). Each line is a self-contained JSON object.
```ndjson theme={null}
{"id":1,"created_at":"2026-05-19T06:36:15Z","server_name":"my-server","tool_name":"get_weather","response_status":"success","status_code":200,"response_time_ms":854}
{"id":2,"created_at":"2026-05-19T06:37:27Z","server_name":"my-server","tool_name":"get_weather","response_status":"success","status_code":200,"response_time_ms":745}
```
#### Large Exports
| Row count | Behaviour |
| -------------- | ------------------------------------------------------------- |
| 0 | Warning toast; no file downloaded |
| 1 – 5,000 | Instant download |
| 5,001 – 50,000 | Download with a browser-slowness warning |
| 50,000+ | Same warning; consider narrowing your filter or using the API |
For recurring large exports, use the [Logs API endpoint](/api-reference/analytics/calls) with `per_page` and pagination to stream data in chunks:
```http theme={null}
GET /wp-json/getmcp/v1/analytics/calls?date_from=2026-05-01&date_to=2026-05-31&per_page=500&page=1
Authorization: Bearer YOUR_API_KEY
```
## Client Breakdown
See which AI clients are using your MCP servers:
 | Client | Detected By |
| -------------- | -------------------- |
| Claude Desktop | User-Agent header |
| Claude Code | User-Agent header |
| Cursor | User-Agent header |
| Windsurf | User-Agent header |
| ChatGPT | User-Agent header |
| Unknown | Unrecognized clients |
## Log Retention
By default, call logs are retained for **30 days**. Configure retention in **GetMCP → Settings → General**.
| Client | Detected By |
| -------------- | -------------------- |
| Claude Desktop | User-Agent header |
| Claude Code | User-Agent header |
| Cursor | User-Agent header |
| Windsurf | User-Agent header |
| ChatGPT | User-Agent header |
| Unknown | Unrecognized clients |
## Log Retention
By default, call logs are retained for **30 days**. Configure retention in **GetMCP → Settings → General**.
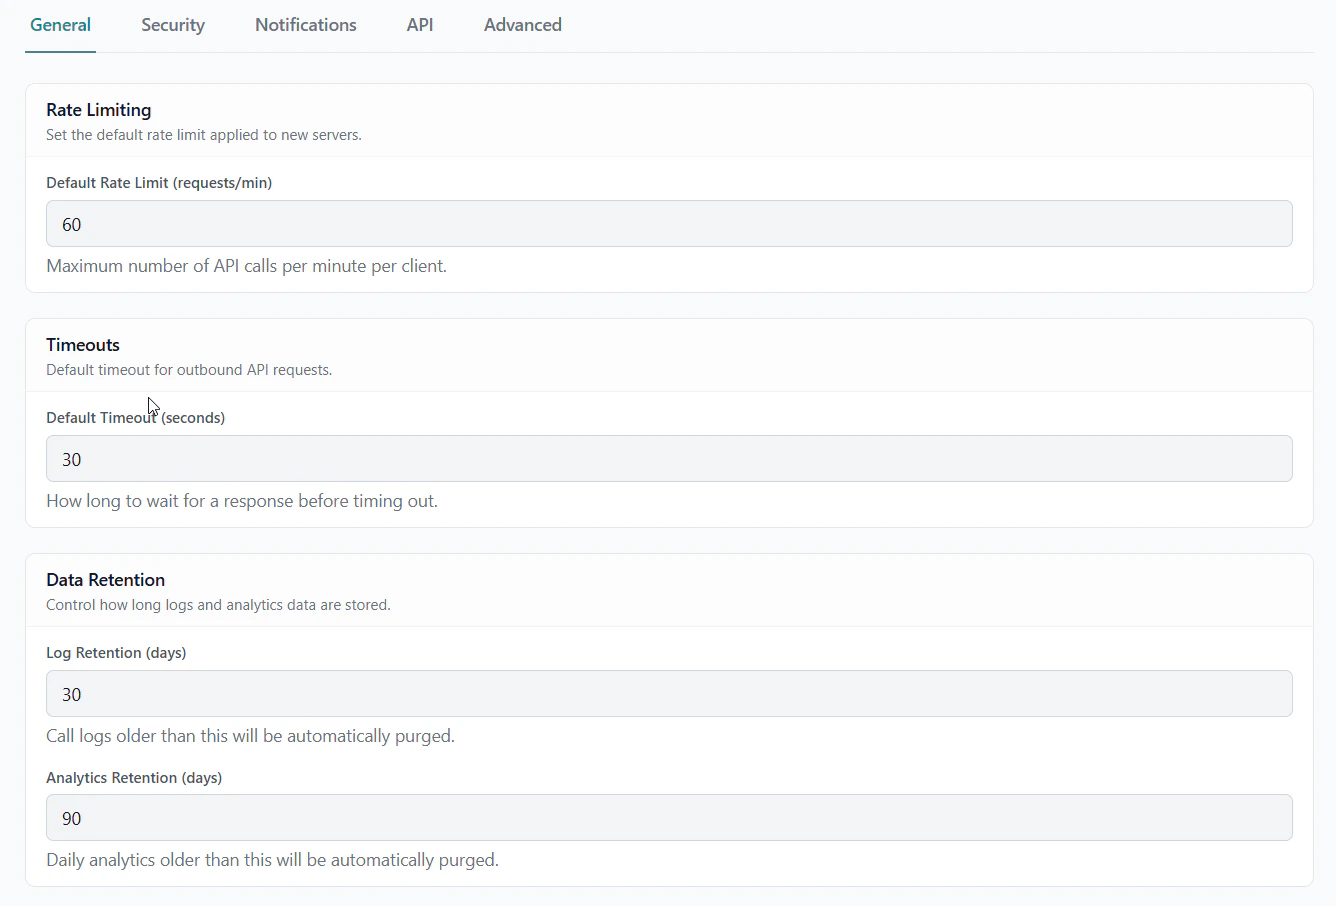 | Setting | Default | Description |
| ---------------------------- | ---------- | ------------------------------------------ |
| **Log Retention Days** | 30 | How long to keep raw call logs |
| **Analytics Retention Days** | 90 | How long to keep aggregated daily stats |
| **Default Rate Limit** | 60 req/min | Applied to all new servers |
| **Default Timeout** | 30 seconds | How long to wait for upstream API response |
## Email Alerts
Configure email notifications for errors, high usage, and health check failures at **GetMCP → Settings → Notifications**.
| Setting | Default | Description |
| ---------------------------- | ---------- | ------------------------------------------ |
| **Log Retention Days** | 30 | How long to keep raw call logs |
| **Analytics Retention Days** | 90 | How long to keep aggregated daily stats |
| **Default Rate Limit** | 60 req/min | Applied to all new servers |
| **Default Timeout** | 30 seconds | How long to wait for upstream API response |
## Email Alerts
Configure email notifications for errors, high usage, and health check failures at **GetMCP → Settings → Notifications**.
 | Setting | Description |
| ------------------------- | ---------------------------------------------------------- |
| **Enable email alerts** | Toggle on to receive alert emails |
| **Notification Email** | Address where alerts are sent |
| **Usage Alert Threshold** | Daily call count that triggers a usage alert (default: 80) |
Emails use WordPress's `wp_mail()`. If alerts aren't arriving, install an SMTP plugin such as WP Mail SMTP.
## Health Checks
Health checks periodically ping your configured tool endpoints to verify they are reachable. Enable them at **GetMCP → Settings → Advanced**.
| Setting | Description |
| ------------------------- | ---------------------------------------------------------- |
| **Enable email alerts** | Toggle on to receive alert emails |
| **Notification Email** | Address where alerts are sent |
| **Usage Alert Threshold** | Daily call count that triggers a usage alert (default: 80) |
Emails use WordPress's `wp_mail()`. If alerts aren't arriving, install an SMTP plugin such as WP Mail SMTP.
## Health Checks
Health checks periodically ping your configured tool endpoints to verify they are reachable. Enable them at **GetMCP → Settings → Advanced**.
 | Setting | Description |
| ------------------------ | ------------------------------------------------------- |
| **Enable health checks** | Automatically test tool endpoints at regular intervals |
| **Check Interval** | How often checks run (every hour, every 6 hours, daily) |
| **Run Health Check** | Manually trigger a check immediately |
Health check failures send an email alert if notifications are enabled.
## Analytics API
Access analytics data programmatically via the REST API:
* [`GET /analytics/overview`](/api-reference/analytics/overview) — Summary stats
* [`GET /analytics/calls`](/api-reference/analytics/calls) — Paginated call logs
* [`GET /analytics/daily`](/api-reference/analytics/daily) — Daily aggregated data
* [`GET /analytics/client-breakdown`](/api-reference/analytics/client-breakdown) — Calls by client type
| Setting | Description |
| ------------------------ | ------------------------------------------------------- |
| **Enable health checks** | Automatically test tool endpoints at regular intervals |
| **Check Interval** | How often checks run (every hour, every 6 hours, daily) |
| **Run Health Check** | Manually trigger a check immediately |
Health check failures send an email alert if notifications are enabled.
## Analytics API
Access analytics data programmatically via the REST API:
* [`GET /analytics/overview`](/api-reference/analytics/overview) — Summary stats
* [`GET /analytics/calls`](/api-reference/analytics/calls) — Paginated call logs
* [`GET /analytics/daily`](/api-reference/analytics/daily) — Daily aggregated data
* [`GET /analytics/client-breakdown`](/api-reference/analytics/client-breakdown) — Calls by client type